Rolling a Die and the Clustering Illusion
One of the first posts I wrote on this blog was about simulating ‘Snakes and Ladders’. Simple games of chance like this are great to think about and
The question that I asked myself while playing a game with my son is “could this I detect if this dice was biased?”. To answer this quesion, I needed data.
LLM Disclosure
Yes I Rolled It 1000 Times
Rolling a die one-thousand times didn’t take as long as I previously thought, only about 35 minutes. For what it’s worth, I swapped back and forth between my left and right hands to reduce the predictability my my rolls, and put a decent amount of momentum into each roll. It was actually quite meditiative. After those thirty five minutes I had my data, and here are the results of the counts:
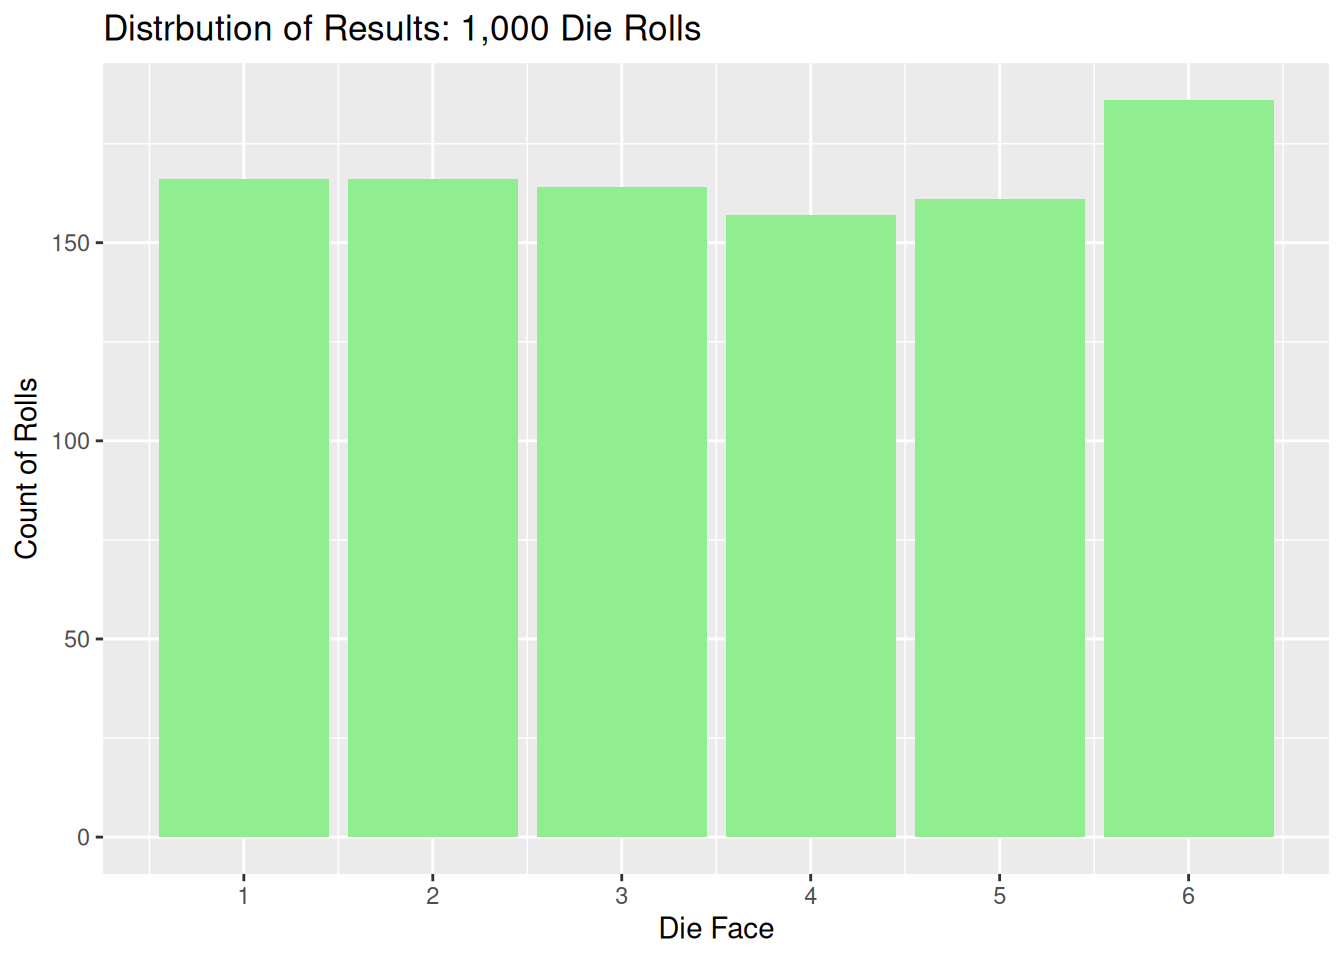 After one-thousand rolls, face 6 peeks its head out above the crowd. Is this evidence of a loaded die? Or is this within the realms of natural variability?
A Trip to Monte Carlo
Here’s our Stan model for our die rolls. Astute readers will notice that the dirchlet/categorical are conjugates and thus there’s an analytical solution, negating the need for a Monte Carlo simulation. But I need Stan practice, so we’ll continue on.
data {
  int<lower=1> n;
  array[n] int<lower=1, upper=6> roll;
}

parameters {
  simplex[6] theta;
}

model {
  theta ~ dirichlet( rep_vector(1, 6) );
  roll  ~ categorical(theta);
}
The Stan program takes the die roll data as an array of rolls of length n. These rolls are drawn from a categorical distribution with with a simplex (a non-negative vector that sums to 1) parameter theta. The posterior distribution of theta we get by running our Stan sampler is the probability distribution over the six die face probabilities. This represents our uncertainty about the probability given our rolls data.
We’re using a dirichlet prior on theta, with all of the alpha values equal to one. What that says is that we expect that all combinations of probabilities have an equal probability density. Each face could have a probability of 1/6, but there’s an equal amount of probability density at 5/6, while the remaining faces have a probability of 1/30. I have the die in my hand and can see and feel that it looks pretty unbiased, so this prior is not a good choice. But let’s roll with it (hah!) for the moment.
Let’s take a look at some of the summary statistics of the theta posteriors:
dice_roll_fit$summary(
    'median', 'sd',
    variables = 'theta'
)
## # A tibble: 6 × 3
##   variable median     sd
##   <chr>     <dbl>  <dbl>
## 1 theta[1]  0.165 0.0116
## 2 theta[2]  0.166 0.0117
## 3 theta[3]  0.164 0.0116
## 4 theta[4]  0.157 0.0114
## 5 theta[5]  0.161 0.0114
## 6 theta[6]  0.185 0.0124
The median of the posterior distribution of faces 1 thru 5 all sit close to 1/6 (.166), but we see theta[6] is deviated. How much of the posterior distribution is above 1/6?
dice_roll_draws <-
dice_roll_fit |>
    spread_draws(theta[face])

dice_roll_draws |>
    filter(face == 6) |>
    summarise(
        percent_side = mean(theta > 1/6)
    )
## # A tibble: 1 × 2
##    face percent_side
##   <int>        <dbl>
## 1     6        0.937
Around 95.5% of it. Rather than single statistics, let’s look a a visualisation of the theta distriubions of each face:
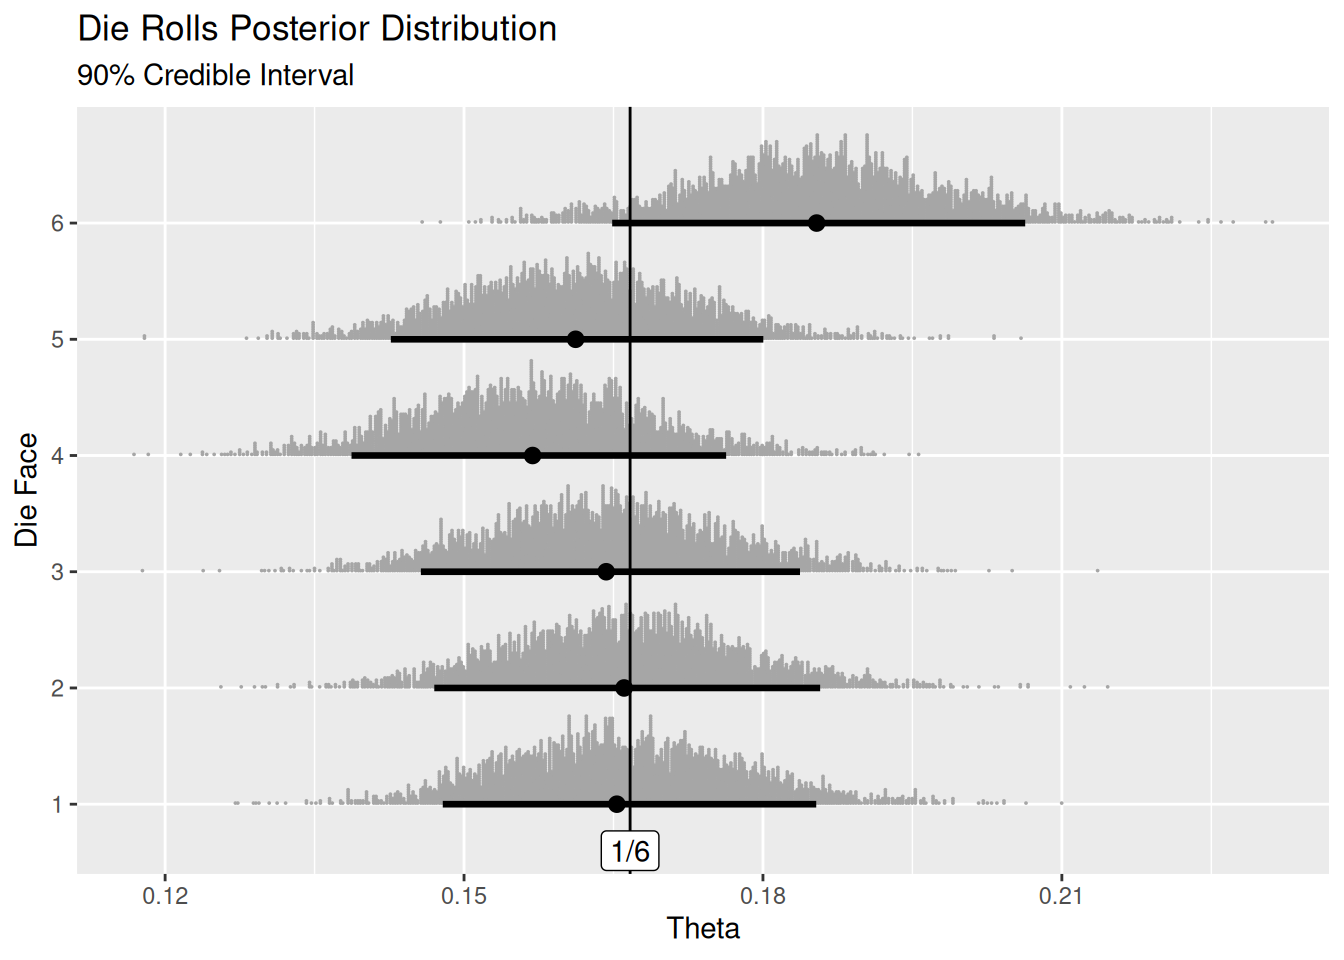 All of the other faces are well inside our 90% credible interval, but face 6 sits outside of it. Surely this means that there’s only a 1:20 chance of this occurring, and we can confidently say that this dice is biased towards 6?
A Failure on I
alpha <- 1
n <- 1000
side6_obs <- 0.9477

mass_above <- function(count) { 1 - pbeta(1/6, alpha + count, 5 * alpha + n - count) }

rmultinom(10000, n, rep(1/6, 6)) |>
    as_tibble() |>
    mutate(face = 1:n()) |>
    pivot_longer(cols = starts_with('V'), names_to = 'sim', names_prefix = 'V', values_to = 'count') |>
    mutate(q = mass_above(count)) |>
    group_by(sim) |>
    summarise(
        q_fixed = q[face == '3'],
        q_max = max(q)
    ) |>
    summarise(
        p_fixed = mean(q_fixed >= side6_obs),
        p_any = mean(q_max >= side6_obs)
    ) |>
    gt() |>
    fmt_percent()
## Warning: The `x` argument of `as_tibble.matrix()` must have unique column names if
## `.name_repair` is omitted as of tibble 2.0.0.
## ℹ Using compatibility `.name_repair`.
## This warning is displayed once per session.
## Call `lifecycle::last_lifecycle_warnings()` to see where this warning was
## generated.
| p_fixed | p_any |
|---|---|
| 4.64% | 27.43% |